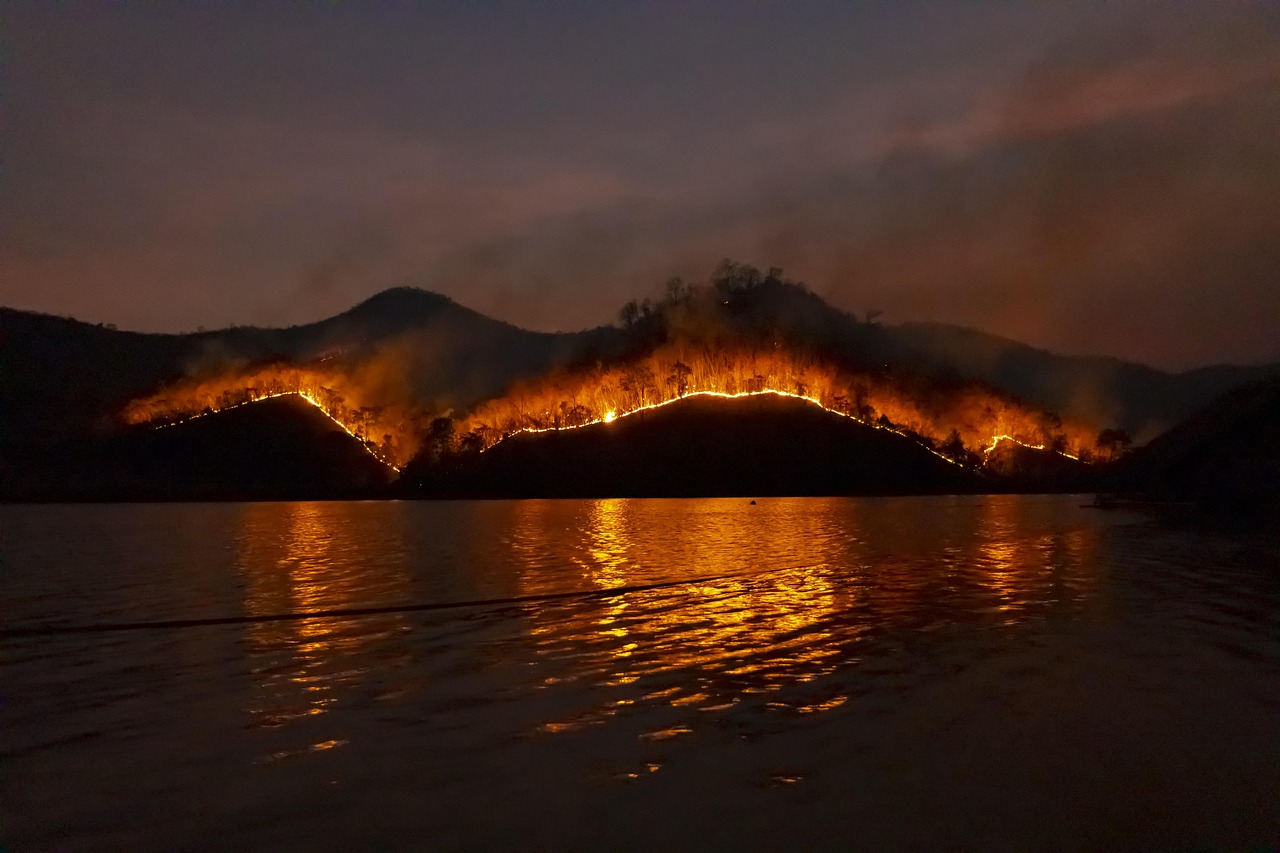
Wildfire smoke is no longer only a disaster for people near a fire line. Fine particles can travel hundreds or thousands of miles, turning an apparently distant fire into an immediate health concern for cities, farms and small towns. That shift has made wildfire smoke monitoring a public-health data problem: communities need to know not merely that smoke exists, but where it is moving, how severe it may become, how long it may last and who is least able to avoid it.
The Canadian wildfires of 2023 made that reality unusually visible across large parts of the United States, when smoke darkened skies far from the fires and pushed air-quality alerts into daily life. The event was not the first of its kind, and it will not be the last. As large fires become a recurring seasonal risk in multiple regions, the systems used to track smoke—satellites, regulatory monitors, lower-cost sensors and atmospheric models—are becoming part of the practical infrastructure of public health.
More timely information can help people change plans, schools adjust outdoor activities and agencies issue health warnings. But data does not distribute protection by itself. Monitoring remains patchy, forecasts contain unavoidable uncertainty and the ability to act on an alert depends heavily on housing, work and access to clean indoor air.
How wildfire smoke monitoring works
Most public-facing air-quality alerts are built around PM2.5: particulate matter measuring 2.5 micrometres or less in diameter. These particles are small enough to penetrate deep into the lungs and can enter the bloodstream. Wildfire smoke contains PM2.5 alongside gases and other pollutants, but PM2.5 is often the central metric used in health guidance because it is a major driver of smoke-related air-quality risk.
No single instrument provides a complete picture. Modern air quality forecasting blends several kinds of evidence:
- Regulatory ground monitors provide high-quality local measurements. In the United States, these instruments support the Air Quality Index and form the backbone of official reporting. Their limitation is geographic: many areas, especially rural ones, are far from a monitor.
- PM2.5 sensors sold at lower cost can add neighborhood-scale detail. Networks of these devices may reveal differences between nearby locations that a sparse official network cannot see. However, their readings can be affected by humidity, particle composition, placement and maintenance. They require careful calibration and should not be treated as interchangeable with regulatory monitors.
- Satellite wildfire data can identify active fires, thermal anomalies, smoke plumes and atmospheric aerosols across enormous areas. Satellites are especially valuable where ground infrastructure is scarce. They do not directly measure the PM2.5 concentration a person is breathing at street level; converting what a satellite sees into surface conditions requires models and supporting observations.
- Atmospheric models estimate where smoke will travel by combining fire emissions estimates with weather data, wind patterns and chemistry. These models underpin many public smoke maps and air quality forecasting tools. They are useful precisely because they can project conditions beyond existing sensors, but a forecast is still an estimate rather than a measurement.
The result is a layered system. A map may show an official monitor reading, a nearby sensor observation and a modeled forecast at the same time. They can point in the same direction while still displaying different numbers.
Why smoke readings can differ from place to place
Disagreement in smoke data is not necessarily a failure. It often reflects the fact that smoke is uneven. Wind can move a plume over one neighborhood while leaving another temporarily clearer. Valleys can trap polluted air. Temperature inversions can keep particles close to the ground. Rain, changing fire behavior and a shift in wind direction can alter conditions faster than a regional forecast can fully capture.
Measurement methods also see different parts of the atmosphere. A satellite may observe a broad plume aloft while a ground monitor records relatively modest surface pollution, or the reverse can happen when local conditions concentrate particles near the ground. Low-cost sensors can be extremely useful during fast-moving events, but they may need humidity corrections and quality checks to avoid misleading readings.
That is why the most useful dashboards increasingly combine observations with forecasts rather than presenting one number as final truth. For an individual reader, the practical lesson is straightforward: check local official guidance, watch trends over several hours and recognize that the conditions outside a home may differ from the regional average.
From air-quality forecasting to decisions
Forecasts matter because smoke exposure is shaped by timing. If air quality is expected to worsen in the afternoon, a school can move sports practice indoors or reschedule it. A construction employer can change the timing of strenuous outdoor work. Health departments can issue alerts before conditions peak, giving people time to acquire filters, limit exertion or identify a cleaner place to spend the day.
Public-health agencies generally advise reducing outdoor activity when particle pollution is high, particularly for children, older adults, pregnant people and people with heart or lung disease. During severe smoke, portable air cleaners with high-efficiency particulate filters and properly fitted respirators can reduce exposure in appropriate settings. Guidance must still account for individual medical needs, heat, housing conditions and the availability of safer indoor spaces.
For emergency planners, near-real-time climate data can support decisions about cooling and clean-air shelters, hospital preparedness, public messaging and the deployment of outreach workers. It also creates a new expectation: if conditions are measurable, residents may reasonably ask why warnings or protective resources did not arrive sooner.
Timely data does not mean equal protection
The central weakness of public health technology is that an alert is not the same as an option. A resident who works outdoors, lacks paid leave or lives in a poorly sealed building may have little ability to reduce smoke exposure. Someone with reliable broadband, air conditioning and a portable purifier can respond very differently to the same notification.
Monitoring coverage can compound that inequality. Remote communities and areas with fewer public resources may have limited access to regulatory monitors. Community sensor networks can help fill gaps, but they depend on funding, technical support, internet connections and residents willing and able to host equipment. Data-rich cities can therefore gain a more detailed picture of local conditions than communities with fewer resources, even when the latter face substantial exposure.
Outdoor readings are also an incomplete proxy for personal exposure. Indoor air depends on filtration, ventilation, building leaks and whether windows are open. People commuting, working outside or moving between buildings may experience dramatically different conditions from those suggested by a single neighborhood sensor.
Better smoke maps can improve decisions, but they cannot substitute for clean indoor air, worker protections, accessible health care and trusted local communication.
The durable challenge: converting measurement into protection
Wildfire smoke monitoring will continue to become faster, more granular and more integrated with weather and emergency systems. Satellite observations can broaden situational awareness, PM2.5 sensors can add local texture and air quality forecasting can provide time to act. Yet the most important question is not whether environmental data can predict a plume more precisely.
It is whether institutions can translate that prediction into protection for people who cannot simply stay indoors. The public-health value of wildfire smoke data will be measured not only in better maps, but in cleaner schools, safer workplaces, better-equipped shelters and warnings that reach the people who need them in time to use them.
Image by sippakorn on Pixabay.